Residential Windows & Attachments
 Window attachments represent a wide range of products that are commonly attached to windows in a house as an "add-on" device.
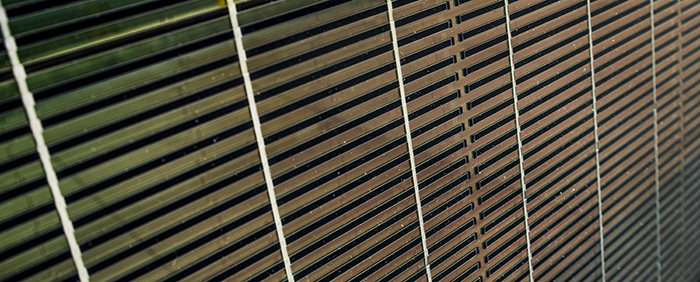
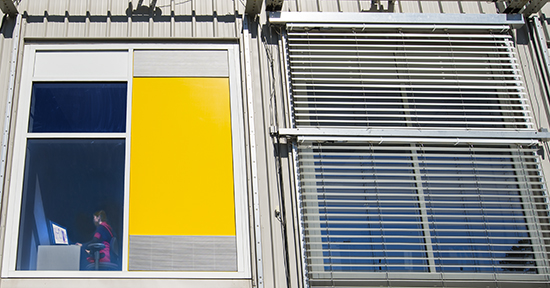
The most common and widely used types of attachments are window coverings and fashions that are typically used to control glare, to provide privacy, and for aesthetic purposes. Drapes are a typical example of this attachment type. Some types of coverings are traditionally used to control solar heat gain in conditioned and unconditioned houses. When they are used in unconditioned houses, they are used to create more comfortable living conditions. Examples of these products are outdoor-mounted louvered shutters, roller shutters and awnings. For the most part, indoor-mounted coverings and window fashions are used more for aesthetic reasons, privacy, and glare control, although some energy benefits of their use is recognized.
While we understand that different types of coverings have varying effects on energy performance of the windows they are installed over, generally their energy performance is not as well understood as that of prime windows. This is because their mounting and occupant use impacts their performance, and their energy impact can be orientation and climate dependent. Some limited measurements were done over the past few decades for both indoor and outdoor-mounted shades. These measurements were done for specific window combinations and in specific climates. Due to the high cost involved in measurements and the uncertainty and lack of standardization of these measurements, it is only possible to observe broader trends from them.
Simulation methods for window coverings and other optically complex systems, including complex glazing, have been steadily advancing over the past decade and now cover a large range of products. With support from the Department of Energy, we have significantly expanded the modeling capabilities of a suite of energy performance assessment tools originally developed for the window industry. Berkeley Lab researchers completed the development and implementation of a generalized Bi-Directional Scattering Distribution Function (BSDF) methodology, which enabled SHGC and Tv of an expanded range of products and devices to be modeled.
The BSDF methodology was first implemented in our WINDOW and THERM programs for calculating thermal and optical performance of windows with coverings and later was extended to EnergyPlus to allow for the calculation of energy impacts of these products on a commercial or residential building.
Related Technologies
 The thermal performance of in-plane products can, in general, be simulated similar to sealed (insulated) glazing with modifications to account for long-wave (IR) radiant transmission, gas flow across attachment layers, and shape factors affecting convection over the surface.
LBNL has developed several attachment models including: cellular shades, vertical louvered blinds and perforated screens. In addition, CGDB, the database containing complex product optical performance data, has been completed and publicly released. In order to have confidence in the newly developed attachment models, they must be validated through extensive testing and detailed CFD simulation. This paper outlines a review and validation of the ISO 15099 center-of-glass (COG) heat transfer correlations for naturally ventilated cavities through measurement and simulation.
Three basic methods are used to determine heat flow though window + attachment configurations; physical testing through steady state measurements, two-dimensional finite element conjugate heat transfer and computational fluid dynamics (FEM) simulation, and one-dimensional simulation based on correlations defined in ISO 15099 through the WINDOW software developed by LBNL.
The LBNL developed simulation program, WINDOW, calculates heat transfer through glazing assemblies based on one-dimensional correlations of average values. The correlations were developed through a variety of means including laboratory measurements, detailed simulations, and analytical models. The correlations and their sources are defined in ISO 15099. Of specific interest for this work is the model presented for thermally driven ventilation. The model is based on introducing a modifier to the unvented correlation to determine a modified average surface-to-air heat transfer coefficient for the between glass space. The result is solved for iteratively as presented in Figure 1. The modifying equations are based on several pressure drop principles for air through a channel including Bernouilli, Hagen-Poiseuille, and entrance/exit correlations. While these equations are physically based, the standard does not cite any validation of the approach through either measurements or detailed simulation.
Steady State Measurements
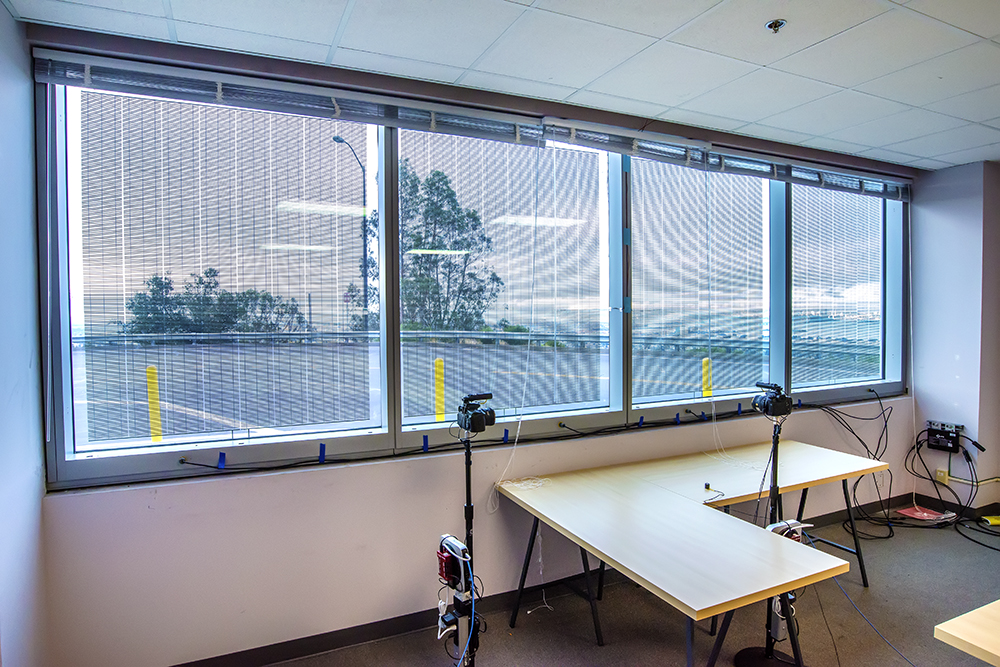
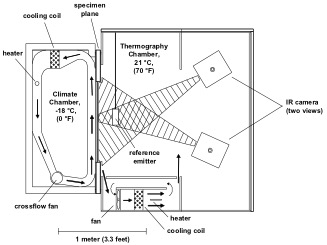
Industry standard quantitative measurement of window heat flow is performed with calorimetric "hot box" instruments as outlined in ISO 12567 (ISO 2010). This method is effective for overall thermal performance but gives little localized information. For this reason, the Windows and Envelope Materials Group at Lawrence Berkeley National Lab (LBNL) has developed a technique for quantitative thermal measurement of windows using IR thermography. The IR thermography technique described by Griffith et al. (1998) and Griffith et al. (2001) allows us to measure window thermal performance with much more accuracy than the ISO test while obtaining detailed information used to verify LBNL's simulation algorithms. The chamber is typically configured to closely match NFRC 100 (2010) boundary conditions of Tc = -18 °C, hc = 26 W m-2 K and Tw = 21 °C, hw determined by natural convection, where Tc and Tw are the temperatures on the cold and warm sides of the test chamber and hc and hw are the surface-to-air heat transfer coefficients. Figure 2 illustrates the test chamber configuration.
Experiments were performed using specially instrumented specimens representing the typical thermal resistances of a glazing system and a shade layer. Both the glazing layer and the shading layer are constructed like calibrated transfer standards (CTS), samples of known thermal resistance with many temperature pair measurements that allow calculating the local heat flux through the specimen in many locations. Thermocouples are placed in a 3 x 6 grid (18 per surface) on the inside surface of two 1080 mm by 775 mm glass panes with a calibrated foam layer between. Figure 3 illustrates the configuration of the CTS specimens utilized for this study and the locations of the sensing thermocouples, TCTS. The measured temperatures are taken to represent the average temperature of the immediate area, A, surrounding each sensor.
Principal Investigator(s)
Charlie Curcija
Team Members
Howdy Goudey
Robert Hart
Jacob Jonsson
The base window energy performance can be significantly improved in many cases with the use of operable attachments. The actual use of the operable attachment, or its deployment states, can have a large effect on energy performance. For example when operable shades are used by occupants in a "typical manner," some shades provide energy savings in specific climates, but not all operable shades save energy in all climates. Results are climate dependent. In cooling dominated climates, all window attachments save energy. In northern and many central climate zones, heating energy is higher than cooling energy, so a combination of insulating properties and balanced solar control saves the most energy. Several window attachments provide little to no energy benefit in heating dominated climates and some perform worse than unshaded windows in terms of total energy use.
Introduction
The selection of attachments included in this study covers both fixed and operable window attachments. In order to properly account for operational schedule of operable attachments, a separate behavioral study was carried out to determine typical use of operable window attachments (DRI 2013). Based on this typical deployment schedule, results of energy analysis are weighted in order to compare them among themselves and to the fixed attachments.
Window attachment products on the market today include a wide range of performance features and styles. To provide wide applicability to the U.S. residential stock, selected product categories are modeled as a set of parameters. The parameters include four building types, three baseline windows, 12 climate zones, four window attachment qualities and three deployment states (cellular shades, roller screens, solar screens, drop-arm awnings) or eight deployment states for louvered blinds (horizontal louvered blinds, also known as venetian blinds, and vertical louvered blinds). Four "qualities" (or solar and thermal performance levels) represent a wide range of performance, including products typically available on the market today but also speculative new high performance products. This choice gives a theoretical range of energy performance. For some window attachments, this range is closer to the performance of available attachments and for some this range is beyond what is currently available. Although the parameters for each quality are developed with the intent that quality A has the most favorable characteristics (e.g., low-e, high insulation, high reflectance, low absorptance) and qualities B, C, and D are progressively "worse," it is recognized that the overall energy outcomes are not necessarily going to be "Best" to "Worst," since in different climates and even in the same climate zone, a combination of parameters might be beneficial and in some cases might be detrimental. Therefore, generic A, B, C, and D quality designations are used to present the range of attachment properties. The complete set of parametric options resulted in 16,486 energy simulation runs.
Energy modeling results of these options are expressed in terms of energy use and energy savings, and presented in graphs and tables. All of the energy use and energy savings reporting in this study is done in terms of site energy, which treats all energy sources equally. Another type of comparison could be done in terms of source energy, where electrical energy, for example, is multiplied by conversion factor representative of source fuels used to produce electric energy. As the mix of energy sources used in producing electricity substantially change over time, this factor also may change, and would need to be updated in the future.
Window Attachment Parametrics
In order to represent a broad range of different window attachment products, four different sets of performance parameters, called "qualities" were developed for each window attachment category. These "qualities" do not necessarily represent real products and for some options, they will be quite different than what is presently offered. However, in order to analyze a full range of performance options, these theoretical limits were explored. The four different product 'qualities' are denoted by A, B, C, and D and are explained later in the section. The following eleven window attachment categories were considered:
| Outdoor Mounted | Indoor Mounted |
|---|---|
| Solar screens | Horizontal louvered blinds |
| Awnings – fixed | Vertical louvered blinds |
| Awnings – drop-arm | Cellular shades |
| Storm panels | Roller shades |
| Surface applied films | Surface applied films |
| Interior fixed Panel |
Several categories of window attachments were not included in this study due to the current lack of reliable simulation models. Many of these models are now under development or validation and should be available later in fiscal year 2014 (FY 2014) or FY 2015. While it is difficult to predict energy effects of these attachment categories, it is believed that they are within the ranges of products analyzed here, with respect to their location (i.e., outdoor and indoor). The following window attachment categories were not considered in this study:
| Excluded Outdoor Mounted | Excluded Indoor Mounted |
|---|---|
| Roller shutters | Sheer shades |
| Louvered shutters | Window quilts |
| Roman shades | |
| Drapes |
Baseline windows are defined from the selection of typical windows installed in existing or new homes. They range in performance from very poor to very good. Three baseline windows are selected for this study:
- Single clear glazing and aluminum alloy frame
- Double clear glazing and wood frame
- Double low-e glazing and vinyl frame
Methodology
Energy use of windows and window attachments was modeled in EnergyPlus using the typical residential buildings described in the previous section. EnergyPlus can model a wide range of shading and otherwise complex systems when the complex optical radiation distribution is calculated in the WINDOW program (LBNL 2013). WINDOW can generate a Bi-Directional Distribution Function (BSDF) which can be exported to EnergyPlus using the IDF file format. BSDF files define a discrete set of incident and outgoing angles, which fully describe the optical performance of any system, simple or complex, limited only by the resolution of the angular discretization. In this method each layer, as well as the whole system, is described by a matrix of incident and outgoing angles. Further details about the BSDF method and its implementation In WINDOW and EnergyPlus software tools can be found in Klems (1994A and 1994B) and DOE (2013b)
The deployment schedule for window attachments was developed from the results of a behavioral study, funded jointly by DOE and the Window Attachment Industry (DRI 2013). Based on the results of the survey of 2,467 households in 12 markets (see Parametrics section for the list of cities), a deployment schedule was developed for 3 periods during the day, for two seasons, and for the three distinct climatic regions in the country. Of the 2,467 households surveyed, 397 households were removed from the dataset due to issues with data quality, leaving 2,100 households for analysis. The behavioral study considered three different attachment deployments and identified the percentage of products that were in one of these three positions at different times of day:
- O: Open
- H: Half-Open
- C: Closed
The periods of day considered were:
- M: Morning, including work hours (6:00 a.m. to 12:00 p.m.)
- A: Afternoon (12:00 p.m. to 6:00 p.m.)
- N: Evening/Night (6:00 p.m. to 6.00 a.m.)
For each deployment state, the heating and cooling energy use is calculated on an hourly basis for each of the parameters considered and labeled EO, EH, EC for open, half-open, and closed, respectively. While energy use for each deployment state is calculated separately, post-processing is applied to the three deployment states to produce weighted energy use for an operable window attachment, representative of the behavioral study.
Results
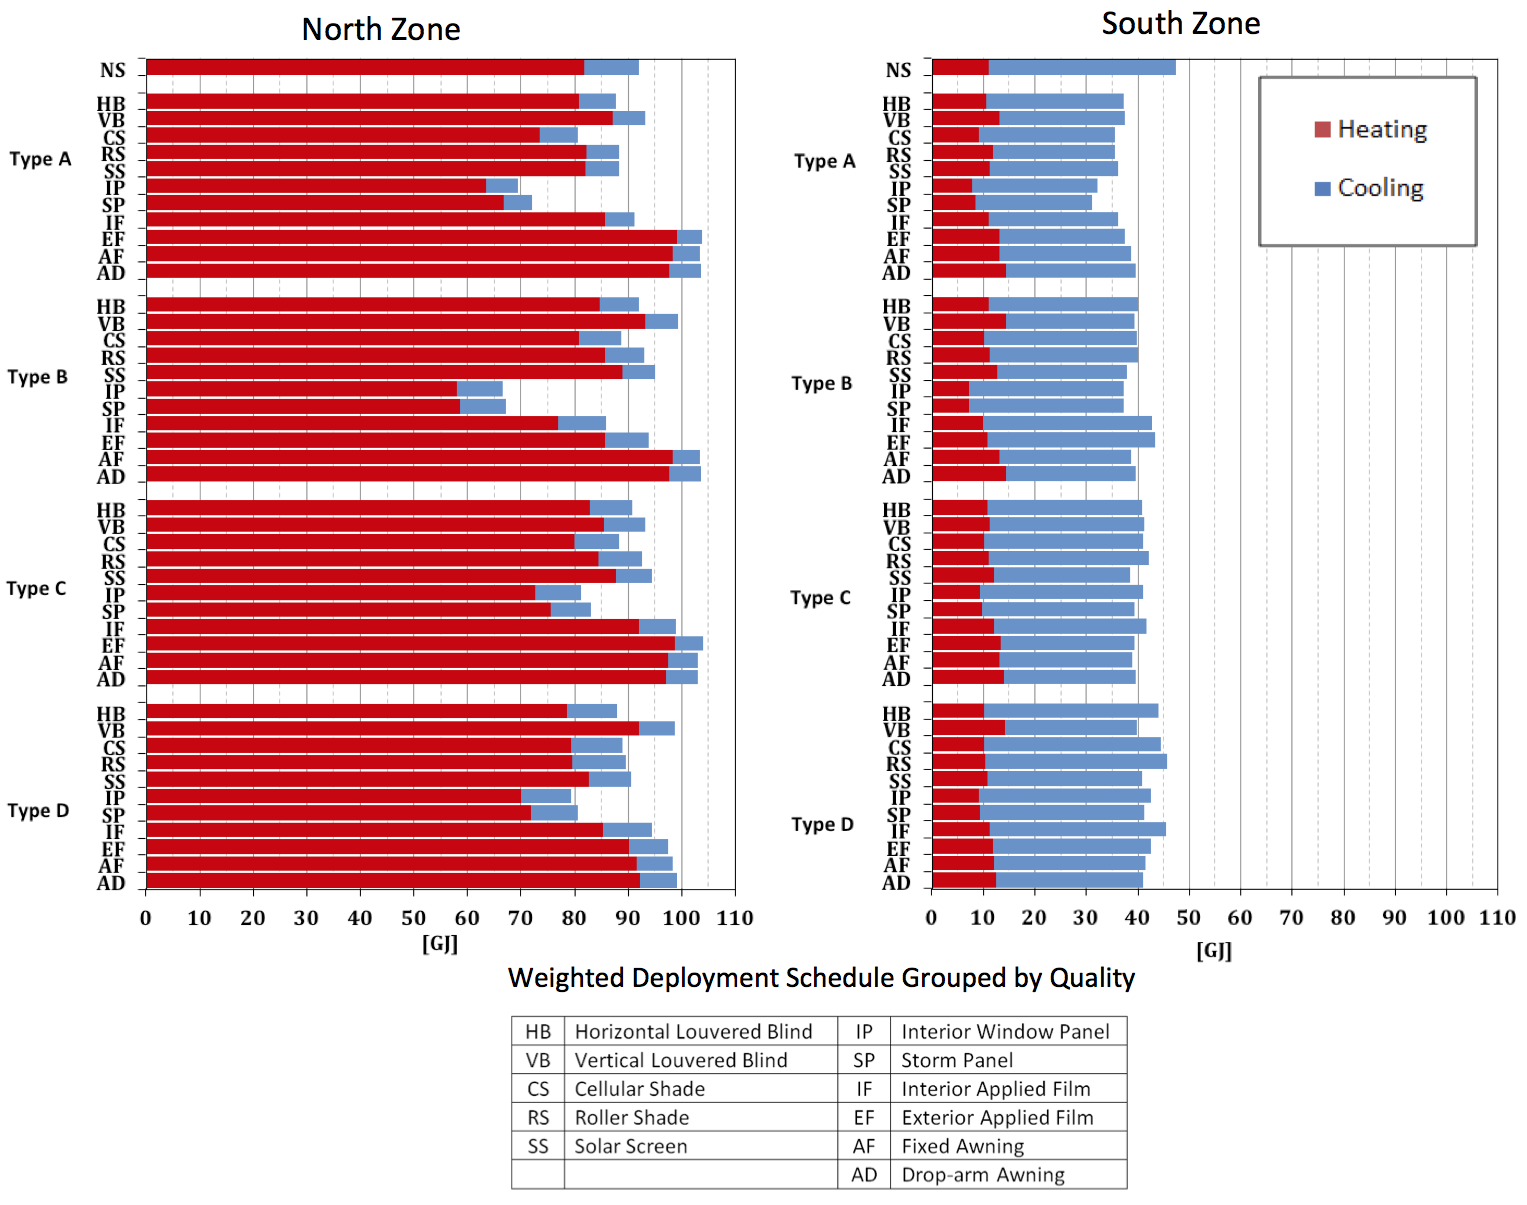
A sample side-by-side comparison of home energy use of all window attachments over double pane clear wood window is provided. Each graph shows results for one climate zone, North and South, using the same representative cities for each zone; Minneapolis and Phoenix respectively. Comparisons are done with the time weighted use results described in Methodology section. Window attachments are grouped by window attachment quality, where all window attachments are compared for each of the four qualities. Energy use is represented by horizontal bars consisting of heating (red) and cooling (blue) stacked bars. This allows display of individual contributions of heating and cooling as well as total energy use.
Energy use in North zone (Minneapolis), where heating energy dominates cooling energy as evidenced by very long red bars and very short blue bars. The unshaded baseline window is shown at the top of the graph for reference. Looking at the distribution of energy use by different qualities it can be observed that the spread between different attachments is larger for quality A and B, which means that for some attachments the input parameters play a larger role than for others. Across all qualities in the North zone, interior window panels, and exterior storm panels consistently show lowest energy use. They perform well in both heating and cooling energy departments so their overall energy use is the lowest. Of all the shades, cellular shades show lowest energy use other than for quality D. Most savings comes from heating savings, although there are also some cooling savings, most pronounced for quality A. As expected, louvered blinds provide some savings in cooling energy for more reflective materials (qualities A and B) with slightly more cooling savings for vertical blinds (block more solar radiation). However, the heating energy penalty for vertical blinds is fairly high, making them worse then the baseline window. The presence of a low-e coating in quality A improves the heating energy slightly and for very dark venetian blinds, however the cooling energy penalty for darker blinds makes them only marginally better than the baseline window. Quality A of Roller shades and solar screens expectedly improves cooling performance and are almost neutral for heating energy, which is due to cancelling effects of low-e coating. The low-e increases insulation and lowers SHGC, decreasing the passive solar heating effect. Awnings, both fixed and operable, unsurprisingly substantially increase the use of heating energy while they substantially decrease cooling energy. However, because the cooling energy is quite small compared to heating energy they impose overall energy penalty across all four qualities. In a case like this a change in operating strategy (e.g., open awnings in winter, close in summer), would clearly improve annual performance.
The following table shows energy savings compared to the baseline case without any attachment installed. The values displayed are for the following house type: slab, gas heating, and electric A/C. A summary table of results for all 12 cities is provided in the report.
Double Clear Glazing -Total Energy Savings [GJ] Compared to an Un-Shaded Baseline for All Attachment Types in a House with Slab, Gas Heating, and Electric A/C, for Four Attachment Qualities (A, B, C, D).
|
Attachment Type |
Minn |
Washington.DC |
Phoenix |
|||||||||
|---|---|---|---|---|---|---|---|---|---|---|---|---|
|
A |
B |
C |
D |
A |
B |
C |
D |
A |
B |
C |
D |
|
| Horizontal Blind |
4.3 |
0.1 |
1.3 |
4.1 |
10.2 |
7.4 |
6.5 |
3.4 |
3.3 |
0.4 |
1.3 |
2.9 |
| Vertical Blind |
-1.2 |
-7.3 |
-1.2 |
-6.7 |
10.0 |
8.0 |
6.2 |
7.5 |
-1.1 |
-5.4 |
-0.4 |
-5.1 |
| Cellular Shade |
11.4 |
3.4 |
3.8 |
3.2 |
11.8 |
7.6 |
6.3 |
2.9 |
8.3 |
2.9 |
3.0 |
2.3 |
| Roller Shade |
3.8 |
-0.9 |
-0.5 |
2.6 |
11.8 |
7.5 |
5.4 |
1.8 |
2.6 |
-0.2 |
0.1 |
1.7 |
| Solar Screen |
3.7 |
-3.0 |
-2.3 |
1.6 |
11.2 |
9.4 |
8.9 |
6.6 |
2.9 |
-2.0 |
-1.3 |
1.5 |
| Interior Window Panel |
22.6 |
25.5 |
10.9 |
12.6 |
15.1 |
10.0 |
6.3 |
4.8 |
15.3 |
16.4 |
7.3 |
8.0 |
| Storm Window |
20.0 |
24.9 |
9.0 |
11.4 |
16.4 |
10.2 |
8.1 |
6.0 |
13.8 |
16.2 |
6.4 |
7.6 |
| Interior Applied Film |
0.9 |
6.1 |
-6.9 |
-2.3 |
11.3 |
4.6 |
5.7 |
2.0 |
1.7 |
4.4 |
-3.2 |
-0.9 |
| Exterior Applied Film |
-11.7 |
-1.9 |
-12.0 |
-5.5 |
10.0 |
4.0 |
8.0 |
4.8 |
-5.9 |
0.1 |
-6.5 |
-2.5 |
| Fixed Awning |
-11.4 |
-11.4 |
-10.8 |
-6.3 |
8.7 |
8.7 |
8.5 |
5.8 |
-6.3 |
-6.3 |
-5.9 |
-3.0 |
| Droparm Awning |
-11.5 |
-11.5 |
-11.0 |
-7.0 |
7.8 |
7.8 |
7.8 |
6.4 |
-7.6 |
-7.6 |
-7.3 |
-4.4 |
| No Shade |
92.1 |
92.1 |
92.1 |
92.1 |
47.4 |
47.4 |
47.4 |
47.4 |
56.7 |
56.7 |
56.7 |
56.7 |
Relevant Publications
Curcija, Charlie, Mehry Yazdanian, Christian Kohler, Robert Hart, Robin Mitchell, Simon Vidanovic. 2013. "Energy Savings from Window Attachments". Lawrence Berkeley National Laboratory.
DRI. 2013. "Residential Windows and Window Coverings: A Detailed View of the Installed Base and User Behavior" D&R International, Ltd. Silver Spring, MD. February 2013.
Principal Investigator(s)
Charlie Curcija
Team Members
Robert Hart
Christian Kohler
Robin Mitchell
Simon Vidanovic
Insulating and reflecting fenestration attachments can be highly cost-effective energy savings measures. These products have the economic potential to save nearly 800 TBtus by 2030. However, there are currently no performance rating mechanisms for assessing the energy performance of fenestration attachments. As a result, the available energy savings cannot be realized because consumers are unable to identify the fenestration attachment products/product lines that have the greatest potential to save energy.
A new fenestration attachments rating and certification program, administered by the newly formed organization Attachments Energy Ratings Coucil (AERC) was established in the Fall of 2014 and has started the development of rating procedures. The AERC is an independent, public interest, non-profit organization whose mission is to rate, label, and certify the performance of window attachments. AERC will serve the public interest by providing accurate and credible information about the energy performance of window attachments, which will help consumers, including homeowners, architects, and builders, make informed decisions about window attachment products. The AERC is comprised of a diverse group of window attachment manufacturers, component manufacturers, public interest organizations, and utilities who are working together to deliver a successful energy rating program for the window attachment industry.
This project funds the Windows and Daylighting Group at LBNL to provide critical technical support that includes development and validation of simulation methods to model thermal, optical and energy performance of fenestration attachments, to develop associated test methods, to develop required data bases, and to assist AERC in the development and establishment of technical documents and rating procedures.
| Attachment | Product Category Major Sub-Types | Product Phase | |||
|---|---|---|---|---|---|
| Interior | Exterior | Fixed | Operable | ||
|
Cellular Shades |
X |
X |
1 |
||
|
Slat Shades |
X |
X |
X |
1 |
|
|
Roller Shades |
X |
X |
X |
1 |
|
|
Storm Windows |
X |
X |
X |
1 |
|
|
Solar Screens |
X |
X |
[1] |
||
|
Awnings |
X |
X |
X |
2 |
|
|
Roller Shutters |
X |
X |
2 |
||
|
Window Quilts |
X |
X |
2 |
||
|
Drapes |
X |
X |
3 |
||
|
Louvered Shutters |
X |
X |
X |
3 |
|
|
Surface Applied Films |
X |
X |
X |
If needed |
|
|
Roman Shades |
X |
X |
3 |
||
|
Pleated Shades |
X |
X |
[1] |
||
|
Sheer Shades |
X |
X |
If needed |
||
Principal Investigator(s)
Charlie Curcija
Team Members
Howdy Goudey
Robert Hart
Jacob Jonsson
Jinqing Peng
This study shows how you can easily and affordably shade your windows to keep your home from getting too hot on sunny days. This phenomenon (what researchers call “solar heat gain”) can threaten occupant comfort and safety, especially during heatwaves. Still, many homes lack adequate protection. All of these solutions can be implemented inexpensively using common household items or items that can easily be purchased online. Additionally, you don’t need specialized tools or expertise to install them. Note that these are ideally temporary fixes, so households with sufficient means should still pursue permanent ones (e.g.,shades—preferably on the outside—or specialized windows or films). In their absence, the stopgap measures described below can help protect you and your loved ones during heatwaves and other exceptional events.
This handout, "DIY Affordable Window Shading" (PDF) provides the DIY/affordable shading options for keeping heat out in extreme heat.
Principal Investigator(s)
Luis Fernandes
Team Members
Anothai Thanachareonkit
Howdy Goudey